Application Monitoring and Observability
Proactive management with key insights into the health and performance of custom and packaged applications.

Holistic application observability
Etiam vitae risus suscipit felis imperdiet scelerisque nec euismod ipsum. Aliquam commodo malesuada est a lacinia. Morbi bibendum sapien et risus porta elementum. Phasellus sed consectetur odio, quis egestas tellus.
Connect and contextualize apps and services
Aggregate disparate data types supporting legacy and modern internally written applications to help troubleshoot issues faster and optimize application performance and user experience.
Expedited problem identification
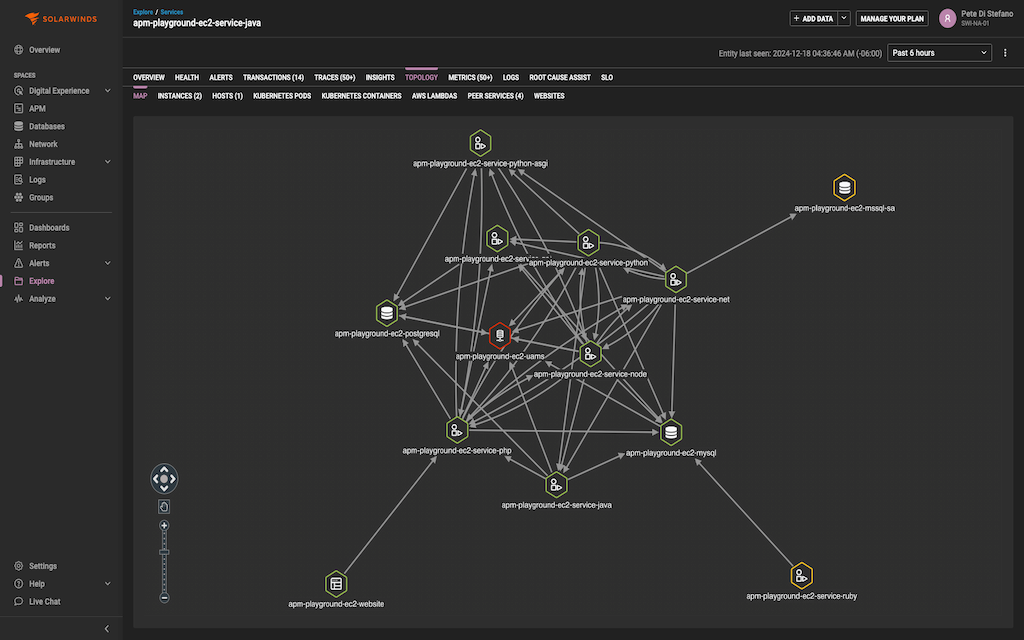
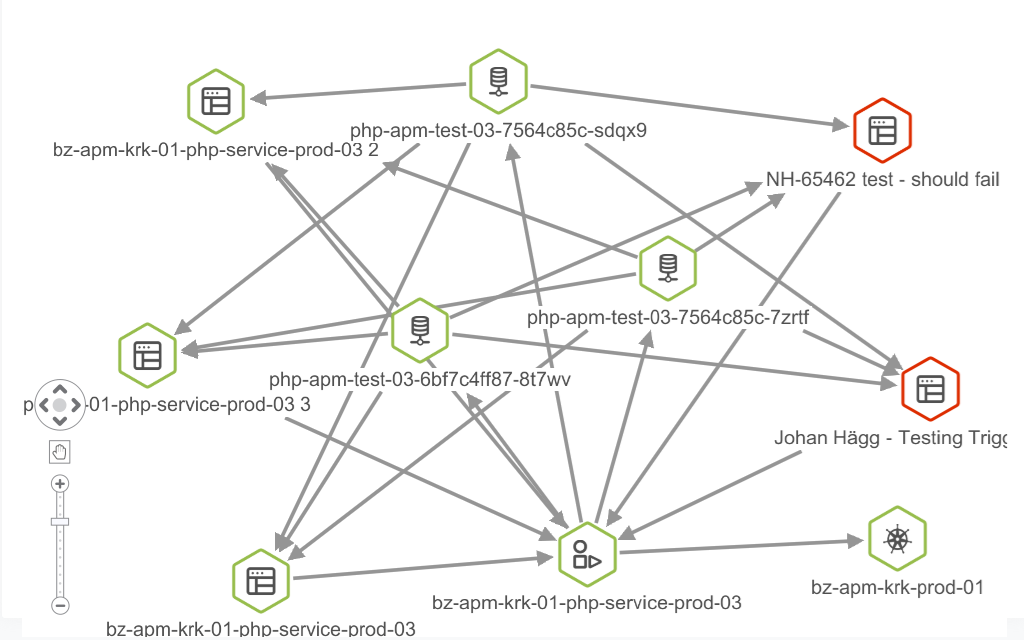
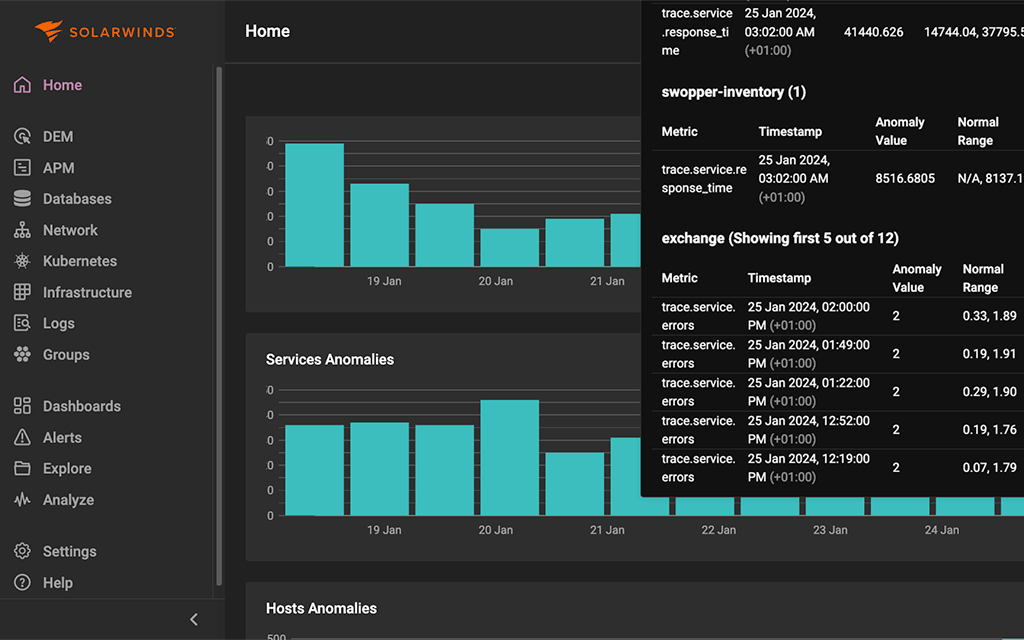
Identify performance bottlenecks and pinpoint the cause of performance issues through distributed waterfall traces, exception tracking, and live code profiling.
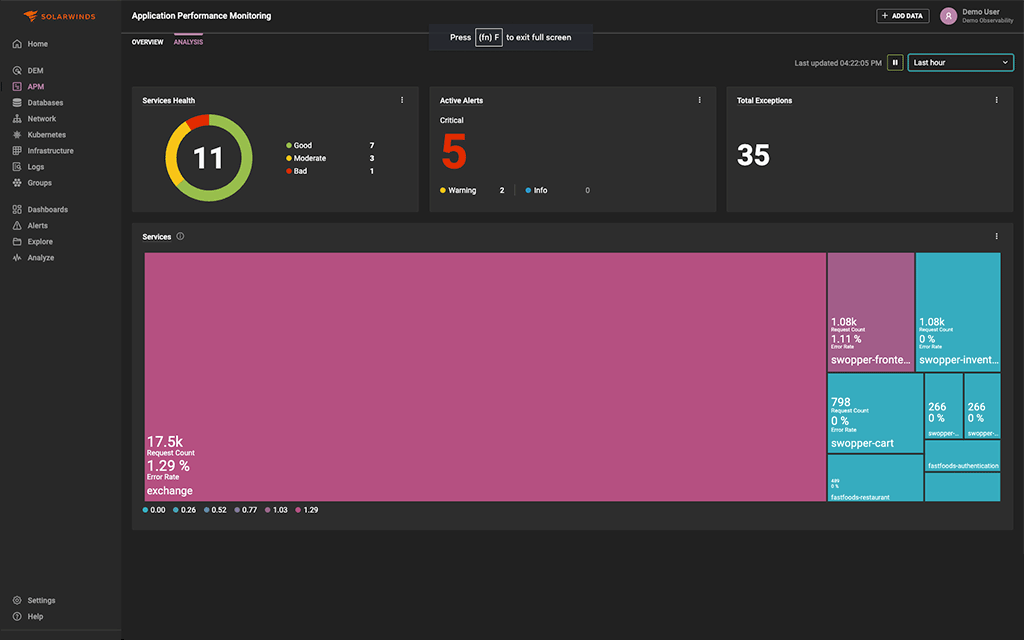
Visualize everything you need in one place
Deliver intelligent insights and increase productivity with unified data from metrics, traces, logs, database queries, and the user experience.
More time deploying, less time firefighting
Focus on innovation and feature delivery with simplified management of complex modern applications.
Making complex application troubleshooting simple
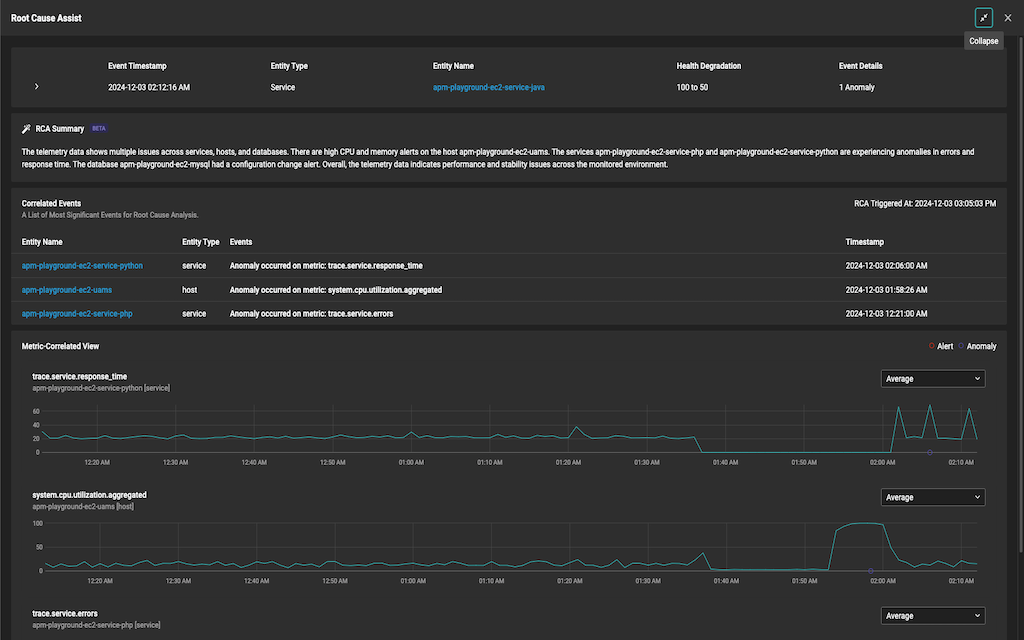
AI/ML-powered Root Cause Assist enhances troubleshooting by providing rich contextual information and automated analysis, reducing MTTI and MTTR. This allows users to improve their IT monitoring and management, staying ahead in the process.
Managing your modern applications made easy
Lorem ipsum dolor sit amet, consectetur adipiscing elit.
- Tab 1
- Tab 2
Etiam eu odio a erat gravida bibendum
Comprehensive code level monitoring
Nulla euismod ante consectetur tellus consectetur the tri fermentum.
Introducing our latest dashboard that enables customers to identify risks in their environment based on vulnerabilities. Vulnerability information is available for Cisco, Juniper, Windows, Linux, and VMware devices.
Key Features:
- Distributed Tracing – Automatically ties together the path of an entire request into a trace waterfall.
- Live Code Profiling – Isolate performance Issues down to the line of code
- Exception Tracking - Summary of exceptions happening within a service context
Second Menu Content Tab 1
Cras elit est, ullamcorper et placerat sit amet, pellentesque vel risus.
Vivamus et ultrices odio. Integer varius sit amet lectus sit
Nam posuere orci sit amet vehicula tempus. Curabitur purus nibh, pulvinar et aliquam eget, laoreet quis sem. Sed sodales felis ut ligula lobortis, et luctus turpis suscipit. Maecenas tempus, diam ac porta tincidunt, enim tellus hendrerit ligula, sit amet auctor justo sapien at nibh.
Vivamus et ultrices odio. Integer varius sit amet lectus sit amet vestibulum. Morbi maximus interdum ligula sed volutpat. Nulla orci dolor, mattis id placerat at, consectetur maximus nisi. Phasellus nec nulla lacinia, sodales orci vitae, imperdiet mi. Praesent vestibulum nisi nisi, ut maximus diam malesuada sed.
Nulla euismod ante consectetur tellus consectetur fermentum. Cras ac euismod sapien. Etiam facilisis nunc nec lectus suscipit malesuada. Vestibulum bibendum faucibus sollicitudin. Aenean eget lacus a magna varius scelerisque quis eget arcu. Phasellus volutpat nibh quis justo pharetra, nec faucibus lacus cursus.

Key Features:
- Lorem ipsum dolor sit amet
- Lorem ipsum dolor sit amet consectetur. Arcu hac orci ullamcorper eu est. Lorem ipsum dolor sit amet consectetur. Arcu hac orci ullamcorper eu est.
- Optional Bold Text sit amet consectetur. Arcu hac orci ullamcorper eu est.
- Lorem ipsum dolor sit amet consectetur. Arcu hac orci ullamcorper eu est. Lorem ipsum dolor sit amet consectetur. Arcu hac orci ullamcorper eu est.
Second Menu Content Tab 1
Cras elit est, ullamcorper et placerat sit amet, pellentesque vel risus.
Vivamus et ultrices odio. Integer varius sit amet lectus sit
Nam posuere orci sit amet vehicula tempus. Curabitur purus nibh, pulvinar et aliquam eget, laoreet quis sem. Sed sodales felis ut ligula lobortis, et luctus turpis suscipit. Maecenas tempus, diam ac porta tincidunt, enim tellus hendrerit ligula, sit amet auctor justo sapien at nibh.
Vivamus et ultrices odio. Integer varius sit amet lectus sit amet vestibulum. Morbi maximus interdum ligula sed volutpat. Nulla orci dolor, mattis id placerat at, consectetur maximus nisi. Phasellus nec nulla lacinia, sodales orci vitae, imperdiet mi. Praesent vestibulum nisi nisi, ut maximus diam malesuada sed.
Nulla euismod ante consectetur tellus consectetur fermentum. Cras ac euismod sapien. Etiam facilisis nunc nec lectus suscipit malesuada. Vestibulum bibendum faucibus sollicitudin. Aenean eget lacus a magna varius scelerisque quis eget arcu. Phasellus volutpat nibh quis justo pharetra, nec faucibus lacus cursus.
Key Features:
- Lorem ipsum dolor sit amet
- Lorem ipsum dolor sit amet consectetur. Arcu hac orci ullamcorper eu est. Lorem ipsum dolor sit amet consectetur. Arcu hac orci ullamcorper eu est.
- Optional Bold Text sit amet consectetur. Arcu hac orci ullamcorper eu est.
- Lorem ipsum dolor sit amet consectetur. Arcu hac orci ullamcorper eu est. Lorem ipsum dolor sit amet consectetur. Arcu hac orci ullamcorper eu est.
Next Feature:
SolarWinds adapts to the way you run your business. Two options. Endless possibilities.
Lorem ipsum dolor sit amet, consectetur adipiscing elit. Duis ullamcorper arcu sed finibus vestibulum. Sed non nibh lectus. Donec lobortis cursus nunc, ac lobortis libero commodo varius.
The highest compliment is our customers' trust
"One of the big . . . benefits is the correlation of moment-in-time data. We can get to the issue faster. We can be more dependable for our customers and our clients. If a problem happens, we can prevent it from reoccurring."
Justin Diana
VP of Information Technology
Corevist

Trusted by leading companies

Observability Products
Lorem ipsum dolor sit amet, consectetur adipiscing elit. In vel nunc diam
Self-hosted observability to take you from reactive to proactive across on-prem and hybrid IT environments.
- Deployment to meet your needs, whether behind your firewall or self-hosted in AWS®, Microsoft® Azure, or GCP®
- Flexible licensing – allocate nodes across multiple instances – and optimal scalability
- Built from our years of network management leadership and enhanced with machine learning
SaaS-delivered observability to simplify management of cloud-native and hybrid IT environments.
- Visibility across your hybrid IT landscape, including custom apps, microservices, Kubernetes, and containers
- Accelerate insights with unified data across metrics, traces, logs, and user experience
- Extensible with open-source framework, public API, and out-of-the-box third-party integrations
Fully functional for 30 days
Case Study
Pine Labs eliminates tool sprawl and accelerates issue resolution.
“There are out-of-box reports that are available, and the kind of reports... is quite amazing...In the longer run, we can reduce MTTD and MTTR up to 40 to 50%.” — Somil Goyal, Infra Architect, Pine Labs


.jpg?auto=webp&disable=upscale)
You may still have questions.
We definitely have answers.
Lorem ipsum dolor sit amet, consectetur adipiscing elit. Duis ullamcorper arcu sed finibus vestibulum. Sed non nibh lectus. Donec lobortis cursus nunc, ac lobortis libero commodo varius.